Consolidated Financial Highlights
Excel Data
Consolidated Statements of profit
Net sales(Millions of yen)
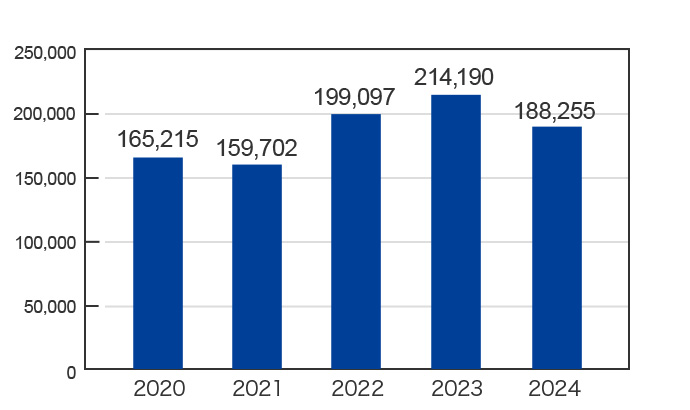
| End of Mar. 2022 | End of Mar. 2023 | End of Mar. 2024 | End of Mar. 2025 | End of Mar. 2026 | |
|---|---|---|---|---|---|
| Net sales | 199,097 | 214,190 | 188,255 | 201,216 | 211,081 |
Operating profit(Millions of yen),Operating margin(%)
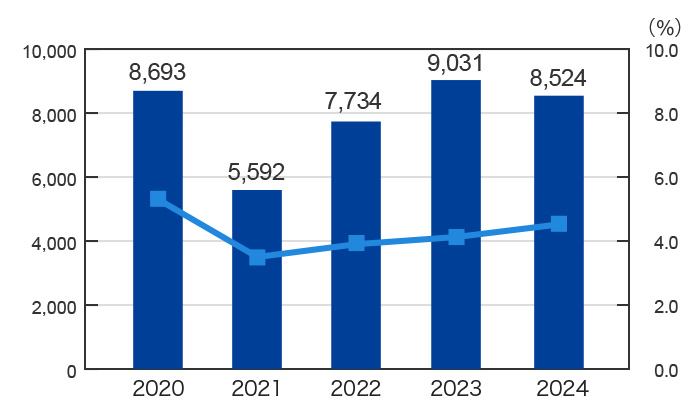
| End of Mar. 2022 | End of Mar. 2023 | End of Mar. 2024 | End of Mar. 2025 | End of Mar. 2026 | |
|---|---|---|---|---|---|
| Operating profit | 7,734 | 9,031 | 8,524 | 9,763 | 11,299 |
| Operating margin | 3.9% | 4.2% | 4.5% | 4.9% | 5.4% |
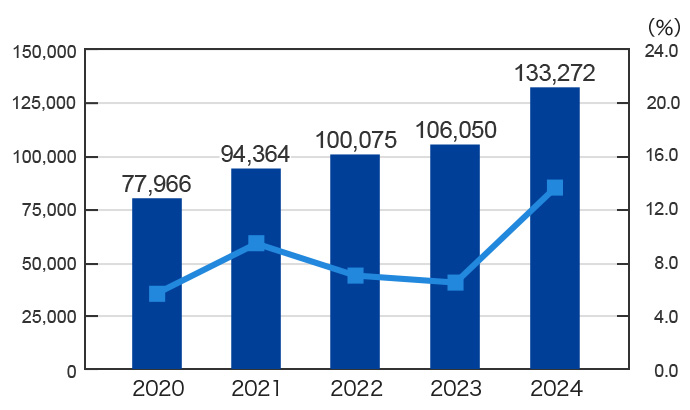
Net profit(Millions of yen),Return on sales(%)
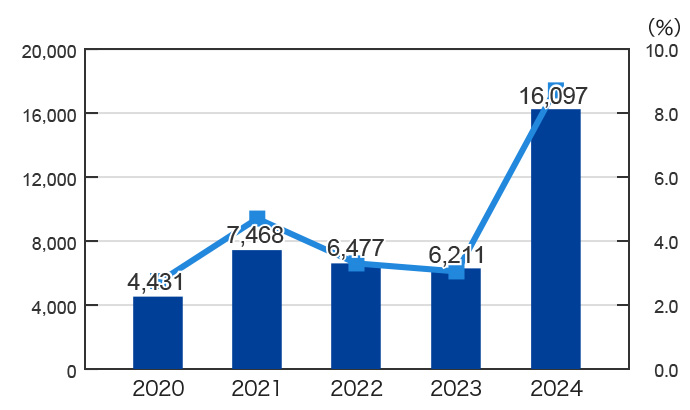
| End of Mar. 2022 | End of Mar. 2023 | End of Mar. 2024 | End of Mar. 2025 | End of Mar. 2026 | |
|---|---|---|---|---|---|
| Net profit | 6,477 | 6,211 | 16,097 | 18,619 | 12,777 |
| Return on sales | 3.3% | 2.9% | 8.6% | 9.3% | 6.1% |
Assets
Total Assets(Millions of yen) , Equity ratio(%)
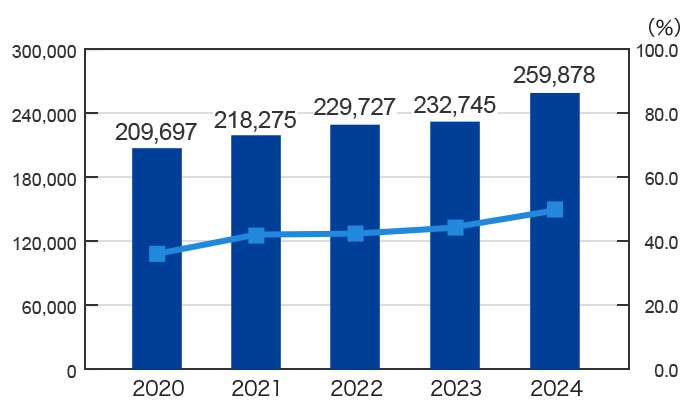
| End of Mar. 2022 | End of Mar. 2023 | End of Mar. 2024 | End of Mar. 2025 | End of Mar. 2026 | |
|---|---|---|---|---|---|
| Total Assets | 229,727 | 232,745 | 259,878 | 257,107 | 272,376 |
| Equity ratio | 42.3% | 44.2% | 50.0% | 50.9% | 54.1% |
Equity(Millions of yen),Return on equity(%)
| End of Mar. 2022 | End of Mar. 2023 | End of Mar. 2024 | End of Mar. 2025 | End of Mar. 2026 | |
|---|---|---|---|---|---|
| Equity | 97,253 | 102,946 | 129,907 | 130,809 | 147,233 |
| Return on equity | 6.9% | 6.2% | 13.8% | 14.3% | 9.2% |
Performance Overview
In fiscal 2025 (April 1, 2025–March 31, 2026), the Japanese economy remained on a moderate
recovery trajectory, with signs of an upturn in personal consumption and capital investment amid
improvements in employment and income conditions. On the other hand, policy trends in various
countries, including U.S. trade policy, caused improvements in corporate earnings, particularly in
the manufacturing sector, to stall. Meanwhile, the international situation remains unstable, as
evidenced by developments in Ukraine and rising tensions in the Middle East. Amid expanding
geopolitical risks and concerns about resource prices and foreign exchange movements, the outlook
for the business environment remains uncertain.
Under these economic conditions, the Furukawa Company
Group posted consolidated net sales of
¥211,081 million, up ¥9,864 million year on year, and operating profit of ¥11,299 million, up
¥1,535 million. The Industrial Machinery segment reported decreases in both sales and operating
profit, while the Rock Drill Machinery and UNIC Machinery segments posted increases in both
sales and operating profit. As a result, the Machinery business as a whole recorded year-on-year
declines in sales and operating profit. Meanwhile, the Materials business reported higher sales and
operating profit across all segments—Metals, Electronics, and Chemicals. The Real Estate business
also posted year-on-year increases in sales and operating profit. Among non-operating income, the
share of profit of entities accounted for using equity method totaled ¥3,110 million. As a result,
ordinary profit amounted to ¥13,733 million, up ¥4,028 million. Among extraordinary income, we
posted a ¥7,223 million gain on sales of investment securities, mainly due to the partial sales of
strategic shareholdings. Among extraordinary losses, we made a ¥2,194 million provision for
environmental measures. After recording income taxes of ¥5,673 million, profit attributable to
owners of parent amounted to ¥12,777 million, down ¥5,841 million year on year.
Segment Performance
| Net Sales | FY2021 (Results) |
FY2022 (Results) |
FY2023 (Results) |
FY2024 (Results) |
FY2025 (Results) |
|---|---|---|---|---|---|
| Machinery | 76,938 | 81,658 | 82,085 | 86,301 | 84,256 |
| Industrial Machinery | 17,723 | 17,943 | 15,548 | 22,213 | 18,268 |
| Rock Drill Machinery | 30,910 | 35,752 | 38,682 | 35,003 | 36,424 |
| UNIC Machinery | 28,305 | 27,961 | 27,853 | 29,084 | 29,563 |
| Materials | 118,163 | 126,804 | 100,388 | 108,757 | 120,380 |
| Metals | 102,995 | 111,424 | 84,712 | 92,384 | 103,067 |
| Electronics | 7,271 | 6,926 | 6,766 | 6,545 | 6,953 |
| Chemicals | 7,896 | 8,454 | 8,908 | 9,827 | 10,359 |
| Real Estate | 2,115 | 2,056 | 1,873 | 2,071 | 2,228 |
| Other | 1,879 | 3,671 | 3,908 | 4,085 | 4,215 |
| [Total] | 199,097 | 214,190 | 188,255 | 201,216 | 211,081 |
| Operating profit | FY2021 (Results) |
FY2022 (Results) |
FY2023 (Results) |
FY2024 (Results) |
FY2025 (Results) |
|---|---|---|---|---|---|
| Machinery | 4,679 | 6,093 | 5,696 | 5,980 | 5,771 |
| (*Composition ratio) | (60%) | (66%) | (64%) | (61%) | (50%) |
| Industrial Machinery | 1,396 | 1,515 | 389 | 2,206 | 1,646 |
| Rock Drill Machinery | 1,117 | 3,030 | 4,148 | 2,795 | 2,851 |
| UNIC Machinery | 2,165 | 1,547 | 1,158 | 977 | 1,273 |
| Materials | 2,349 | 2,309 | 2,765 | 3,169 | 4,994 |
| (*Composition ratio) | (30%) | (25%) | (31%) | (32%) | (44%) |
| Metals | 940 | 1,276 | 1,945 | 2,418 | 3,790 |
| Electronics | 666 | 500 | 212 | 125 | 365 |
| Chemicals | 743 | 532 | 608 | 625 | 837 |
| Real Estate | 743 | 835 | 470 | 686 | 693 |
| (*Composition ratio) | (10%) | (9%) | (5%) | (7%) | (6%) |
| Other | 17 | △133 | △293 | 15 | 48 |
| (Sub Total) | 7,789 | 9,104 | 8,638 | 9,852 | 11,507 |
| Adjustment | △54 | △73 | △114 | △89 | △207 |
| [Total] | 7,734 | 9,031 | 8,524 | 9,763 | 11,299 |